As sustainability metrics become central to regulatory frameworks, corporate reporting, and market expectations, the Global Feed LCA Institute (GFLI) database has become a critical tool for the animal products value chain.
By providing reliable and regularly updated life cycle assessment (LCA) data for more than a thousand feed ingredients, at both global and country-specific levels, the GFLI database equips feed millers and the whole livestock industry with essential insights to guide formulation choices, reduce emissions, and confidently support sustainability commitments.
In January 2026, the GFLI database was updated from version 2.2 to version 3.0 following the release of the updated AgriFootprint dataset. Laura Nobel, project manager for GFLI, explains the new update: “As a database provider, we aim for annual updates for the newest available background data and new methodological approaches to increase the representativeness of the ingredients in scope of our database. The new database, version 3.0, contains a variety of back-end updates that have an effect on the figures you’ll find in the database.”
New ingredient datasets were added and outdated peat oxidation correction factors were removed to rely instead on more reliable national default values. New 5-year averages were used within the Agri-Footprint datasets, reflecting the range of 2018 to 2022 statistical data from FAOstat for yield, manure, seed input, pesticides, production statistics and trade.
The GFLI database includes Agri-footprint data. This data source has had several technical updates introduced to improve consistency, including water requirement ratios removed for irrigation and rainwater, updated fertiliser information at country level coming from International Fertilizer Association (IFA), the addition of a crop system efficiency index, and revised heavy metal emission calculations.
To help the feed sector understand what has changed and why it matters, this article presentsan overview of the key updates and their implications for feed sustainability assessments.
From 2.2 (2024) to 3.0 (2026) GFLI version – global evolutions and examples for some countries
A detailed analysis of these changes reveals that the new data can noticeably influence environmental results depending on the impact category, ingredient type, and production region.
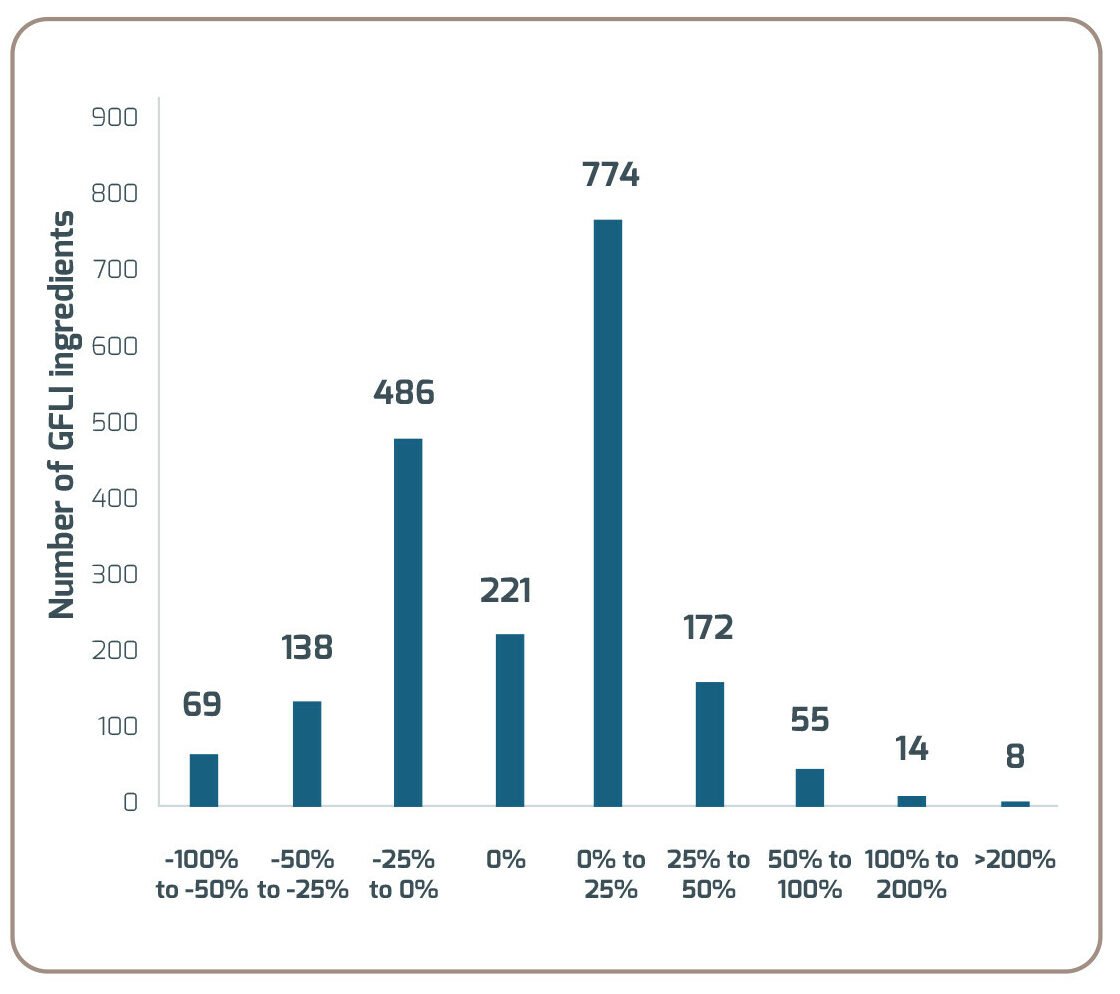
Differences between -99% and +722% in total climate change (including LU&LUC) were observed between the v3.0 and v2.2 versions of GFLI (Figure 1).
The comparison between the previous and the updated GFLI climate change values shows that changes do not follow a single direction: depending on the country and the raw material, results either decrease or increase (Table 1). These shifts reflect methodological updates and more recent data integrated into the new Agri-footprint and GFLI datasets.
Table 1 – Differences on climate change, including land use and land use change value (%) between v3.0 and v2.2 of GFLI database (Economic allocation, EF3.1 method) *

Beyond South America, changes are more heterogeneous. Europe shows moderate increases for several commodities (e.g., corn +23%, wheat +9%), while the US sees more limited movements, generally between -2% and +9% depending on the product. China exhibits mostly decreases, notably for sorghum (-56%) and rapeseed oil (-22%). Other regions show mixed trends: Thailand, for example, displays reductions for rice (-4%) but increases for by-products such as rice bran (+9%).
Overall, the updated GFLI dataset provides a more precise reflection of current agricultural systems: some regions benefit from methodological improvements and period change, while others experience upward adjustments as calculations become more accurate and transparent.
Impacts on the feed – example of broiler formula in European context

These updated ingredient values change the environmental footprint of feed and may bring new conclusions and trends. The following example shows the differences for broiler formula in European context.


For the same feed composition, the new version of GFLI database brings a -18% decrease in total climate change (including LU and LUC), mainly due to a decrease on the LU and LUC value of soybean meal and soybean oil (Figure 2 & 3).
However, regarding other impact categories, such as water use and eutrophication, freshwater, the consequences are the reverse: a higher impact is calculated with the new version of the database. For water use, corn has a relatively high increase, while for eutrophication, freshwater, the increase is driven for both soybean meal and corn. Both factors are attributed due to a shift in the values sourced from the statistical data (FAOstat).
Conclusion and redefining the impacts with the latest data
Updates in databases such as GFLI, whether due to new data or methodological revisions, are an inherent part of the LCA process. Therefore, the purpose of this article is not to determine whether the new version is more favorable or unfavorable to the livestock value chains, but rather to emphasize how strongly impact results can vary depending on the assessment context.
Most important is to consider these new values when calculating environmental footprints of feed. Clear communication about which database version has been used and how your figures compare are necessary to avoid misunderstandings and unrightful comparisons between ingredients of compound feed. Using the latest figures and aligning with the newest methodological practices is key to uniformise the industry worldwide and then define an action plan for improvement within the company and its suppliers.
Adisseo has integrated this new GFLI database version into its ADICT tool. Part of SustainWay, Adisseo’s sustainability journey service, ADICT enables users to easily integrates nutritional and environmental data of ingredients into their feed formulation software. By using it, you ensure to get the latest and most up-to-dated data to work on your feed calculations.